Memory Allocation and Garbage Collections
The Stack and the Heap
Stack Memory and Heap Space in Java
Stack Memory in Java
Stack Memory in Java is used for static memory allocation and the execution of a thread. It contains primitive values that are specific to a method and references to objects referred from the method that are in a heap.
Access to this memory is in Last-In-First-Out (LIFO) order. Whenever we call a new method, a new block is created on top of the stack which contains values specific to that method, like primitive variables and references to objects.
When the method finishes execution, its corresponding stack frame is flushed, the flow goes back to the calling method, and space becomes available for the next method.
Key Features of Stack Memory
Some other features of stack memory include:
- It grows and shrinks as new methods are called and returned, respectively.
- Variables inside the stack exist only as long as the method that created them is running.
- It’s automatically allocated and deallocated when the method finishes execution.
- If this memory is full, Java throws java.lang.StackOverFlowError.
- Access to this memory is fast when compared to heap memory.
- This memory is threadsafe, as each thread operates in its own stack.
Heap Space in Java
Heap space is used for the dynamic memory allocation of Java objects and JRE classes at runtime. New objects are always created in heap space, and the references to these objects are stored in stack memory.
These objects have global access and we can access them from anywhere in the application.
We can break this memory model down into smaller parts, called generations, which are:
- Young Generation – this is where all new objects are allocated and aged. A minor Garbage collection occurs when this fills up.
- Old or Tenured Generation – this is where long surviving objects are stored. When objects are stored in the Young Generation, a threshold for the object’s age is set, and when that threshold is reached, the object is moved to the old generation.
- Permanent Generation – this consists of JVM metadata for the runtime classes and application methods.
Key Features of Java Heap Memory
Some other features of heap space include:
- It’s accessed via complex memory management techniques that include the Young Generation, Old or Tenured Generation, and Permanent Generation.
- If heap space is full, Java throws java.lang.OutOfMemoryError.
- Access to this memory is comparatively slower than stack memory
- This memory, in contrast to stack, isn’t automatically deallocated. It needs Garbage Collector to free up unused objects so as to keep the efficiency of the memory usage.
- Unlike stack, a heap isn’t threadsafe and needs to be guarded by properly synchronizing the code.
Example
 class Person {
    int id;
    String name;

    public Person(int id, String name) {
        this.id = id;
        this.name = name;
    }
}

public class PersonBuilder {
    private static Person buildPerson(int id, String name) {
        return new Person(id, name);
    }

    public static void main(String[] args) {
        int id = 23;
        String name = "John";
        Person person = null;
        person = buildPerson(id, name);
    }
}
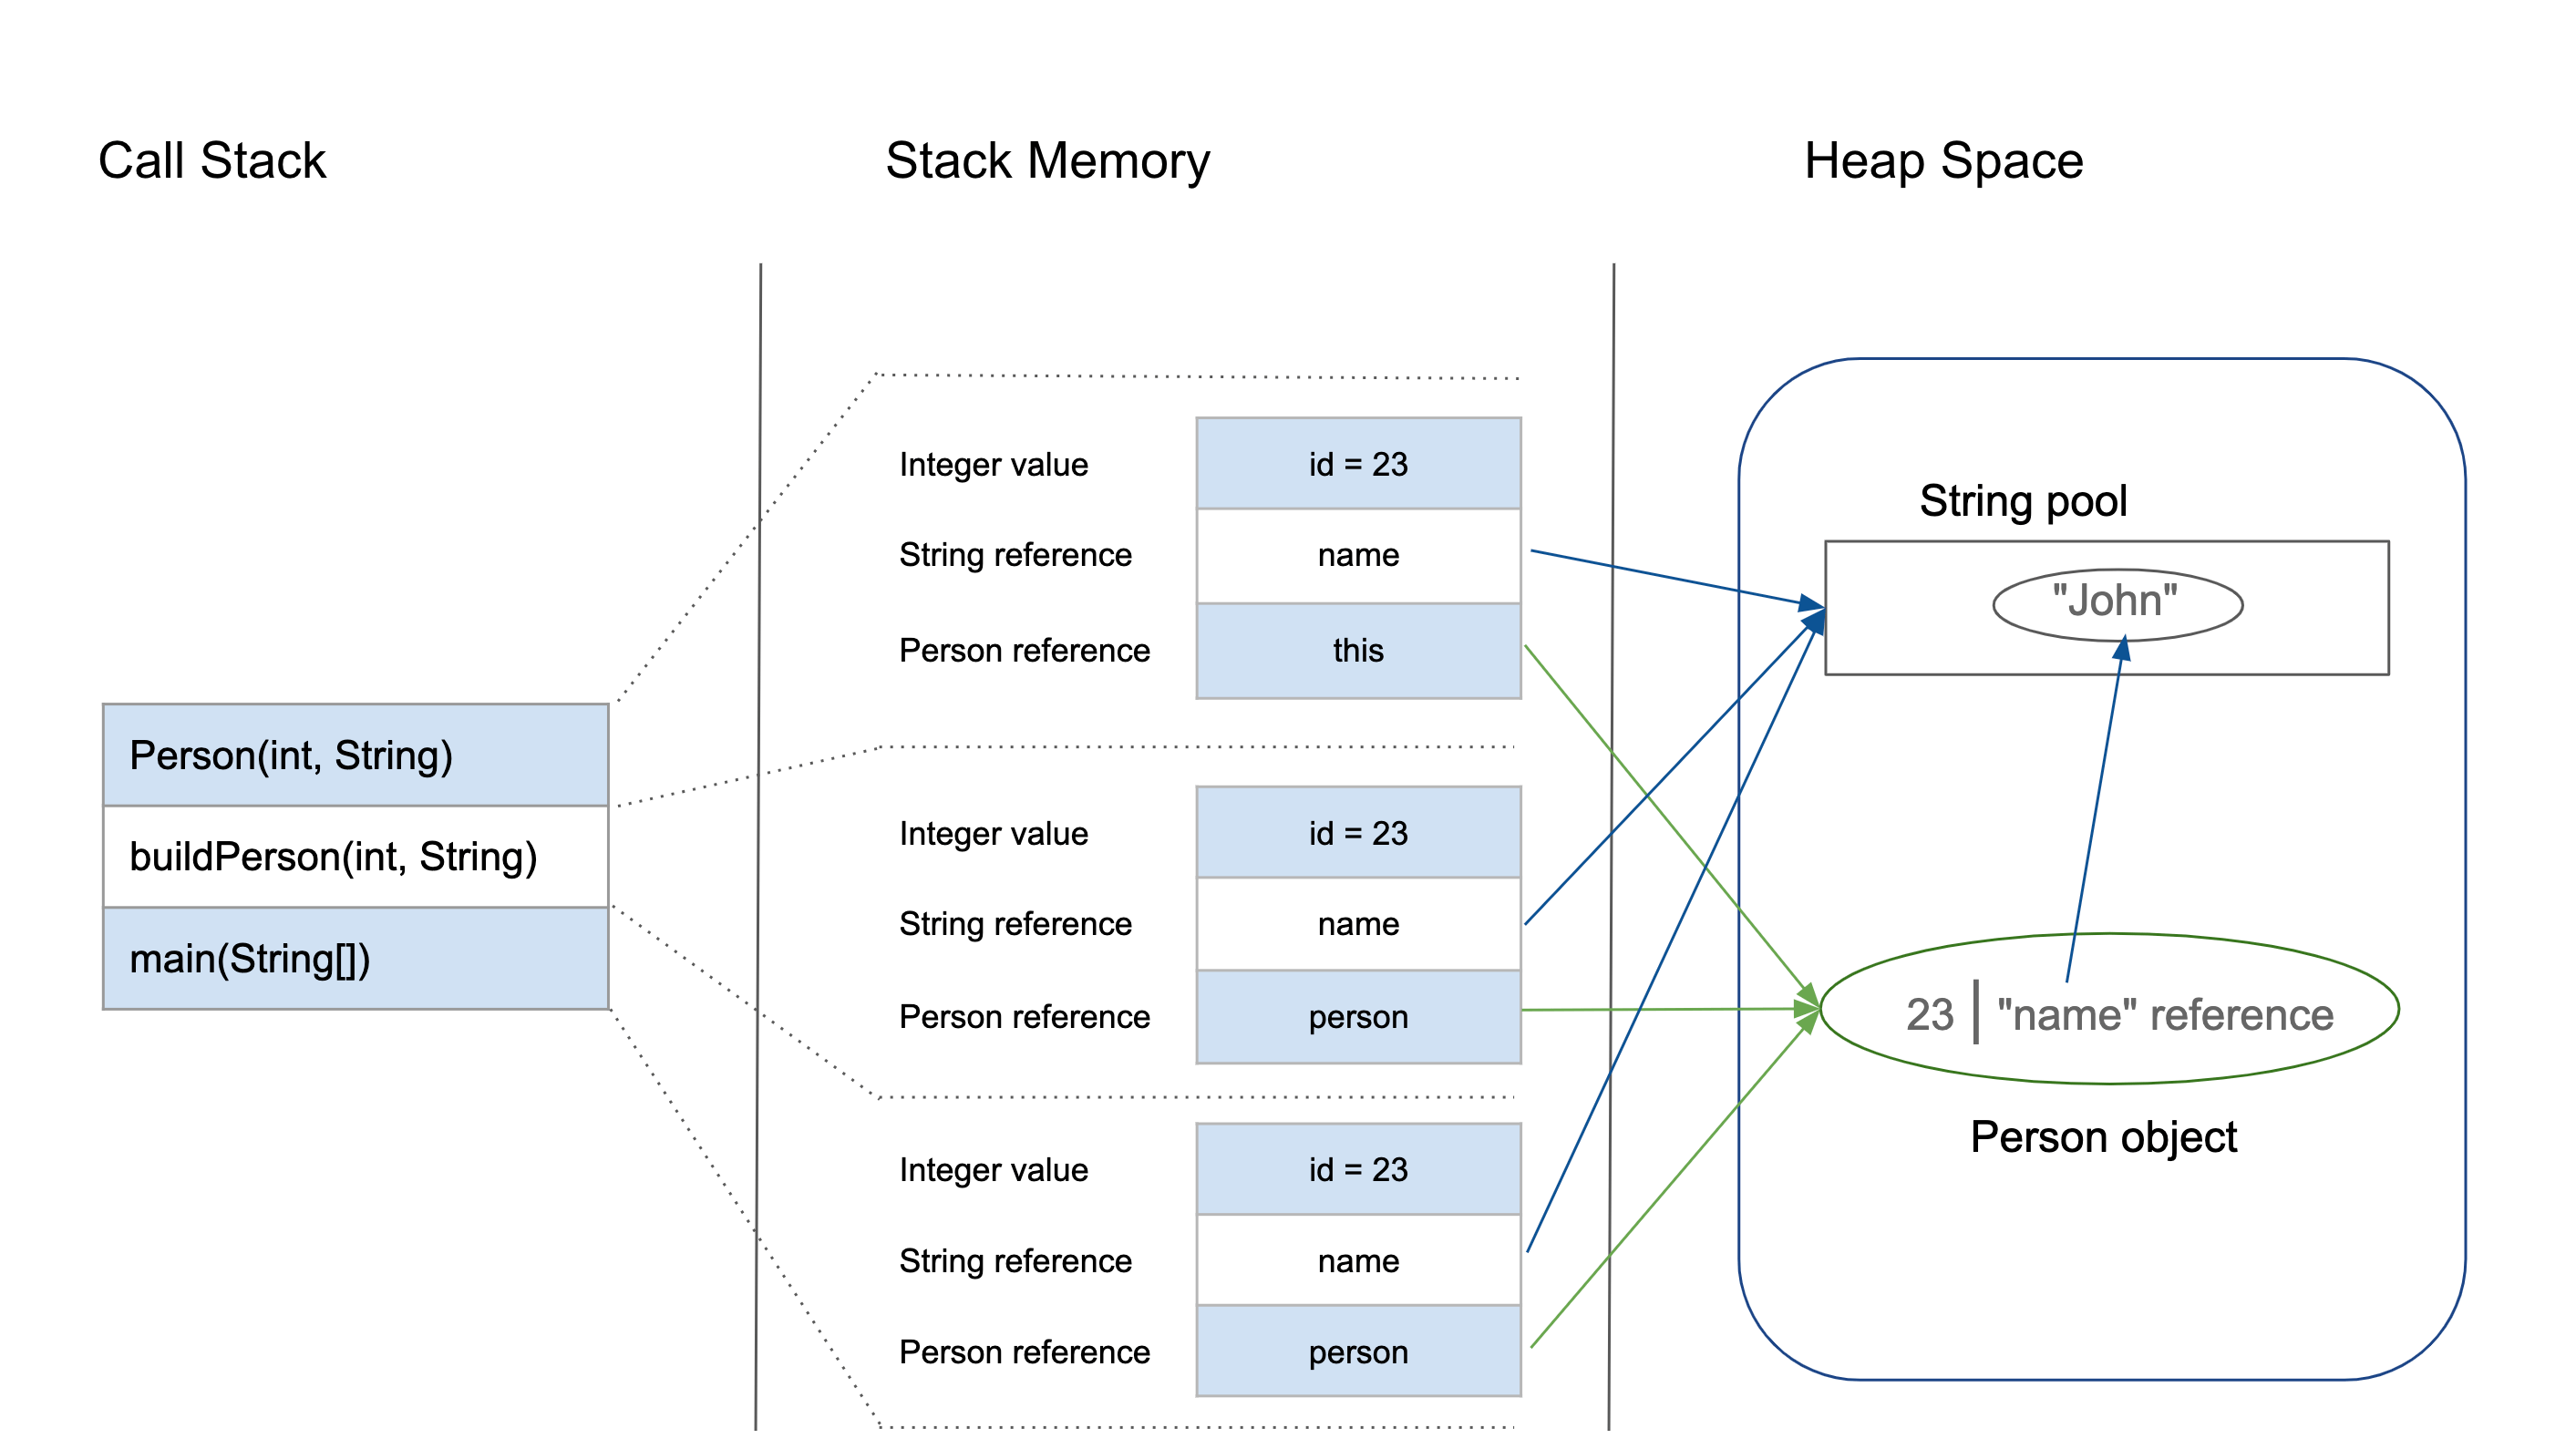
Let’s analyze this step-by-step:
- When we enter the main() method, a space in stack memory is created to store primitives and references of this method.
- Stack memory directly stores the primitive value of integer id.
- The reference variable person of type Person will also be created in stack memory, which will point to the actual object in the heap.
- The call to the parameterized constructor Person(int, String) from main() will allocate further memory on top of the previous stack. This will store:
- The this object reference of the calling object in stack memory
- The primitive value id in the stack memory
- The reference variable of String argument name, which will point to the actual string from string pool in heap memory
- The main method is further calling the buildPerson() static method, for which further allocation will take place in stack memory on top of the previous one. This will again store variables in the manner described above.
- However, heap memory will store all instance variables for the newly created object person of type Person.
Summary
| Parameter | Stack Memory | Heap Space |
|---|---|---|
| Application | Stack is used in parts, one at a time during execution of a thread | The entire application uses Heap space during runtime |
| Size | Stack has size limits depending upon OS, and is usually smaller than Heap | There is no size limit on Heap |
| Storage | Stores only primitive variables and references to objects that are created in Heap Space | All the newly created objects are stored here |
| Order | It’s accessed using Last-in First-out (LIFO) memory allocation system | This memory is accessed via complex memory management techniques that include Young Generation, Old or Tenured Generation, and Permanent Generation. |
| Life | Stack memory only exists as long as the current method is running | Heap space exists as long as the application runs |
| Efficiency | Much faster to allocate when compared to heap | Slower to allocate when compared to stack |
| Allocation/Deallocation | This Memory is automatically allocated and deallocated when a method is called and returned, respectively | Heap space is allocated when new objects are created and deallocated by Gargabe Collector when they’re no longer referenced |
Heap Space / Heap Memory / Java Heap
Java Heap stores your primary Java program Class instances. Memory is allocated from a large pool of unused memory area called the heap (also called the free store). When a Java program starts, Java Virtual Machine (JVM) gets some memory from Operating System. JVM uses this memory for all its needs and part of this memory is call java heap memory. Heap in Java generally is located at bottom of address space and move upwards. Whenever we create objects using new operator or by any another means, object is allocated memory from Heap and when object dies or garbage collected, memory goes back to Heap space in Java.
How to increase size of Java Heap
Default size of Heap in Java is 128MB on most of 32 bit Sun’s JVM but its highly varies from JVM to JVM e.g. default maximum and start heap size for the 32-bit Solaris Operating System (SPARC Platform Edition) is -Xms=3670K and -Xmx=64M and Default values of heap size parameters on 64-bit systems have been increased up by approximately 30%. Also if you are using throughput garbage collector in Java 1.5 default maximum heap size of JVM would be Physical Memory/4 and default initial heap size would be Physical Memory/16. Another way to find default heap size of JVM is to start an application with default heap parameters and monitor in using JConsole which is available on JDK 1.5 onwards, on VMSummary tab you will be able to see maximum heap size. By the way you can increase size of java heap space based on your application need and I always recommend this to avoid using default JVM heap values. if your application is large and lots of object created you can change size of heap space by using JVM command line options -Xms and -Xmx. Xms denotes starting size of Heap while Xmx denotes maximum size of Heap in Java. There is another parameter called -Xmn which denotes Size of new generation of Java Heap Space. Only thing is you can not change the size of Heap in Java dynamically, you can only provide Java Heap Size parameter while starting JVM.
Java Heap and Garbage Collection
Objects are created inside heap memory and Garbage collection is a process which removes dead objects from Java Heap space and returns memory back to Heap in Java. For the sake of Garbage collection Heap is divided into three main regions named as New Generation, Old or Tenured Generation and Perm space. New Generation of Java Heap is part of Java Heap memory where newly created object allocated memory, during the course of application object created and died but those remain live they got moved to Old or Tenured Generation by Java Garbage collector thread on Major collection. Perm space of Java Heap is where JVM stores Meta data about classes and methods, String pool and Class level details.
OutOfMemoryError in Java Heap
When JVM starts JVM heap space is the initial size of Heap specified by -Xms parameter, as application progress objects creates and JVM expands Heap space in Java to accommodate new objects. JVM also run garbage collector to reclaim memory back from dead objects. JVM expands Heap in Java some where near to Maximum Heap Size specified by -Xmx and if there is no more memory left for creating new object in java heap , JVM throws java.lang.outofmemoryerror and your application dies. Before throwing OutOfMemoryError No Space in Java Heap, JVM tries to run garbage collector to free any available space but even after that not much space available on Heap in Java it results into OutOfMemoryError. To resolve this error you need to understand your application object profile i.e. what kind of object you are creating, which objects are taking how much memory etc. you can use profiler or heap analyzer to troubleshoot OutOfMemoryError in Java. “java.lang.OutOfMemoryError: Java heap space” error messages denotes that Java heap does not have sufficient space and cannot be expanded further while “java.lang.OutOfMemoryError: PermGen space” error message comes when the permanent generation of Java Heap is full, the application will fail to load a class or to allocate an interned string.
Java Heap dump
Java Heap dump is a snapshot of Java Heap Memory at a particular time. This is very useful to analyze or troubleshoot any memory leak in Java or any Java.lang.outofmemoryerror. There is tools available inside JDK which helps you to take heap dump and there are heap analyzer available tool which helps you to analyze java heap dump. You can use “jmap” command to get java heap dump, this will create heap dump file and then you can use “jhat - Java Heap Analysis Tool” to analyze those heap dumps.
- Java Heap Memory is part of Memory allocated to JVM by Operating System.
- Whenever we create objects they are created inside Heap in Java.
- Java Heap space is divided into three regions or generation for sake of garbage collection called New Generation,
1.ld or tenured Generation or Perm Space.
- You can increase or change size of Java Heap space by using JVM command line option -Xms, -Xmx and -Xmn.
1.on’t forget to add word “M” or “G” after specifying size to indicate Mega or Giga. for example you can set java heap 1.ize to 258MB by executing following command java -Xmx256m HelloWord.
- You can use either JConsole or Runtime.maxMemory(), Runtime.totalMemory(), Runtime.freeMemory() to query about
1.eap size programmatic in Java.
- You can use command “jmap” to take Heap dump in Java and “jhat” to analyze that heap dump.
- Java Heap space is different than Stack which is used to store call hierarchy and local variables.
- Java Garbage collector is responsible for reclaiming memory from dead object and returning to Java Heap space.
- Don’t panic when you get java.lang.outofmemoryerror, sometimes its just matter of increasing heap size but if it’s
1.ecurrent then look for memory leak in Java.
- Use Profiler and Heap dump Analyzer tool to understand Java Heap space and how much memory is allocated to each
object.
garbage collection
Objects are created inside heap memory and Garbage collection is a process which removes dead objects from Java Heap space and returns memory back to Heap in Java. The automatic detection and freeing of memory that is no longer in use. The Java runtime system performs garbage collection so that programmers never explicitly free objects. It is the opposite of manual memory management, which requires the programmer to specify which objects to deallocate and return to the memory system.
- objects are created on heap in Java irrespective of there scope e.g. local or member variable. while its worth noting that class variables or static members are created in method area of Java memory space and both heap and method area is shared between different thread.
- Garbage collection is a mechanism provided by Java Virtual Machine to reclaim heap space from objects which are eligible for Garbage collection.
- Garbage collection relieves java programmer from memory management which is essential part of C++ programming and gives more time to focus on business logic.
- Garbage Collection in Java is carried by a daemon thread called Garbage Collector.
- Before removing an object from memory Garbage collection thread invokes finalize () method of that object and gives an opportunity to perform any sort of cleanup required.
- You as Java programmer can not force Garbage collection in Java; it will only trigger if JVM thinks it needs a garbage collection based on Java heap size.
- There are methods like System.gc () and Runtime.gc () which is used to send request of Garbage collection to JVM but it’s not guaranteed that garbage collection will happen.
- If there is no memory space for creating new object in Heap Java Virtual Machine throws OutOfMemoryError or java.lang.OutOfMemoryError heap space
- J2SE 5(Java 2 Standard Edition) adds a new feature called Ergonomics goal of ergonomics is to provide good performance from the JVM with minimum of command line tuning.
When an Object becomes Eligible for Garbage Collection
An Object becomes eligible for Garbage collection or GC if its not reachable from any live threads or any static refrences in other words you can say that an object becomes eligible for garbage collection if its all references are null. Cyclic dependencies are not counted as reference so if Object A has reference of object B and object B has reference of Object A and they don’t have any other live reference then both Objects A and B will be eligible for Garbage collection.
Generally an object becomes eligible for garbage collection in Java on following cases:
- All references of that object explicitly set to null e.g. object = null
- Object is created inside a block and reference goes out scope once control exit that block.
- Parent object set to null, if an object holds reference of another object and when you set container object’s
1.ference null, child or contained object automatically becomes eligible for garbage collection.
- If an object has only live references via WeakHashMap it will be eligible for garbage collection.
Heap Generations for Garbage Collection in Java
Java objects are created in Heap and Heap is divided into three parts or generations for sake of garbage collection in Java, these are called as Young generation, Tenured or Old Generation and Perm Area of heap. New Generation is further divided into three parts known as Eden space, Survivor 1 and Survivor 2 space. When an object first created in heap its gets created in new generation inside Eden space and after subsequent Minor Garbage collection if object survives its gets moved to survivor 1 and then Survivor 2 before Major Garbage collection moved that object to Old or tenured generation.
Permanent generation of Heap or Perm Area of Heap is somewhat special and it is used to store Meta data related to classes and method in JVM, it also hosts String pool provided by JVM as discussed in my string tutorial why String is immutable in Java. There are many opinions around whether garbage collection in Java happens in perm area of java heap or not, as per my knowledge this is something which is JVM dependent and happens at least in Sun’s implementation of JVM. You can also try this by just creating millions of String and watching for Garbage collection or OutOfMemoryError.
Types of Garbage Collector in Java
Java Runtime (J2SE 5) provides various types of Garbage collection in Java which you can choose based upon your application’s performance requirement. Java 5 adds three additional garbage collectors except serial garbage collector. Each is generational garbage collector which has been implemented to increase throughput of the application or to reduce garbage collection pause times.
- Throughput Garbage Collector: This garbage collector in Java uses a parallel version of the young generation collector. It is used if the -XX:+UseParallelGC option is passed to the JVM via command line options . The tenured generation collector is same as the serial collector.
- Concurrent low pause Collector: This Collector is used if the -Xingc or -XX:+UseConcMarkSweepGC is passed on the command line. This is also referred as Concurrent Mark Sweep Garbage collector. The concurrent collector is used to collect the tenured generation and does most of the collection concurrently with the execution of the application. The application is paused for short periods during the collection. A parallel version of the young generation copying collector is sued with the concurrent collector. Concurrent Mark Sweep Garbage collector is most widely used garbage collector in java and it uses algorithm to first mark object which needs to collected when garbage collection triggers.
- The Incremental (Sometimes called train) low pause collector: This collector is used only if -XX: +UseTrainGC is passed on the command line. This garbage collector has not changed since the java 1.4.2 and is currently not under active development. It will not be supported in future releases so avoid using this and please see 1.4.2 GC Tuning document for information on this collector.
Important point to not is that -XX:+UseParallelGC should not be used with -XX:+UseConcMarkSweepGC. The argument passing in the J2SE platform starting with version 1.4.2 should only allow legal combination of command line options for garbage collector but earlier releases may not find or detect all illegal combination and the results for illegal combination are unpredictable. It’s not recommended to use this garbage collector in java.
JVM Parameters for garbage collection in Java
Garbage collection tuning is a long exercise and requires lot of profiling of application and patience to get it right. While working with High volume low latency Electronic trading system I have worked with some of the project where we need to increase the performance of Java application by profiling and finding what causing full GC and I found that Garbage collection tuning largely depends on application profile, what kind of object application has and what are there average lifetime etc. for example if an application has too many short lived object then making Eden space wide enough or larger will reduces number of minor collections. you can also control size of both young and Tenured generation using JVM parameters for example setting -XX:NewRatio=3 means that the ratio among the young and tenured generation is 1:3 , you got to be careful on sizing these generation. As making young generation larger will reduce size of tenured generation which will force Major collection to occur more frequently which pauses application thread during that duration results in degraded or reduced throughput. The parameters NewSize and MaxNewSize are used to specify the young generation size from below and above. Setting these equal to one another fixes the young generation. In my opinion before doing garbage collection tuning detailed understanding of garbage collection in java is must and I would recommend reading Garbage collection document provided by Sun Microsystems for detail knowledge of garbage collection in Java. Also to get a full list of JVM parameters for a particular Java Virtual machine please refer official documents on garbage collection in Java. I found this link quite helpful though http://www.oracle.com/technetwork/java/gc-tuning-5-138395.html
Full GC and Concurrent Garbage Collection in Java
Concurrent garbage collector in java uses a single garbage collector thread that runs concurrently with the application threads with the goal of completing the collection of the tenured generation before it becomes full. In normal operation, the concurrent garbage collector is able to do most of its work with the application threads still running, so only brief pauses are seen by the application threads. As a fall back, if the concurrent garbage collector is unable to finish before the tenured generation fill up, the application is paused and the collection is completed with all the application threads stopped. Such Collections with the application stopped are referred as full garbage collections or full GC and are a sign that some adjustments need to be made to the concurrent collection parameters. Always try to avoid or minimize full garbage collection or Full GC because it affects performance of Java application. When you work in finance domain for electronic trading platform and with high volume low latency systems performance of java application becomes extremely critical an you definitely like to avoid full GC during trading period.
Summary on Garbage collection in Java
- Java Heap is divided into three generation for sake of garbage collection. These are young generation, tenured or old generation and Perm area.
- New objects are created into young generation and subsequently moved to old generation.
- String pool is created in Perm area of Heap, garbage collection can occur in perm space but depends upon JVM to JVM.
- Minor garbage collection is used to move object from Eden space to Survivor 1 and Survivor 2 space and Major collection is used to move object from young to tenured generation.
- Whenever Major garbage collection occurs application threads stops during that period which will reduce application’s performance and throughput.
- There are few performance improvement has been applied in garbage collection in java 6 and we usually use JRE 1.6.20 for running our application.
- JVM command line options –Xmx and -Xms is used to setup starting and max size for Java Heap. Ideal ratio of this parameter is either 1:1 or 1:1.5 based upon my experience for example you can have either both – Xmx and –Xms as 1GB or –Xms 1.2 GB and 1.8 GB.
- There is no manual way of doing garbage collection in Java.
TODO
https://www.baeldung.com/java-memory-management-interview-questions
https://www.baeldung.com/jvm-garbage-collectors